Abstract
The built environment is the main contributor to the popularity and attractiveness of tourist destinations across the globe. Buildings, landmarks, and iconic public spaces carry symbolic weights that often depend on their own visual appeal and on visitors’ individual perceptions (Fainstein, 1999). Throughout the last 20 years, image-focused social media marketing strategies and international flows of capital, combined with an increase in disposable income, have contributed to the skyrocketing popularity of some places. This series of intertwined socio-economic phenomena have put entire cities – like Venice – into an existential conundrum: can a city be both a tourist attraction and a nice place to live?
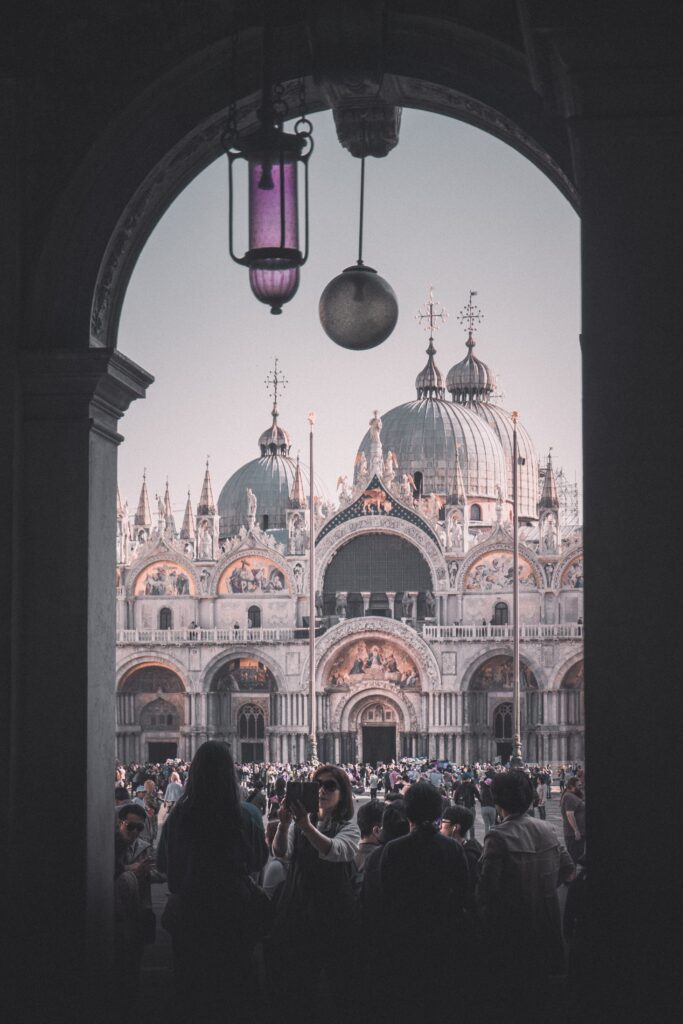
A group of tourists snaps some selfies from the ground floor of the former Palazzo Reale, at the west end of Piazza San Marco, looking out from the deep shade of the classical arcade. The numerous arches of the Procuratie act as urban frames for astonishing views of San Marco Basilica | © Jiakun He, 2018
Because of the deep interaction between the physical environment and tourism, this study employs a data-driven approach to examine the spatial implications of tourism-city relationships. We are aware that this task is particularly difficult since the boundaries between industries serving tourists and those providing services to residents and commuters are permeable and ambiguous (Judd, 2003).
“Of course, tourists are welcome, but the purpose of preserving heritage is lost: you invest public resources for preserving heritage, and then the beneficiary is essentially a private industry that has not contributed to the effort, and on top, it alienates the citizens. To achieve a balance, a management process is extremely important.”
Francesco Bandarin, UNESCO Assistant Director-General for Culture
VOLUME 55, 2019
Through the case study of Venice, this project constructs a spatial narrative of tourism in the historic center of this Italian city. More specifically, this study addresses the following research questions:
I. How can we construct a “Tourism Index” that detects areas of “tourism saturation” at a granular level by taking into account the complex socio-economic fabric of the city of Venice?

II. What’s the predictive power of urban form parameters (such as street width, landmarks, public spaces) to explain the Venetian tourism-city relationship?

Why now?
This pandemic revealed the volatility, unpredictability, and fragility of the tourism sector. We hope that by enriching the spatial understanding of how tourism and physical spaces are deeply intertwined, we can build a more socio-economically resilient Venice. As Forbes’ Rebecca Ann Hughes wrote on May 8th, “is coronavirus the last chance to save Venice?”.
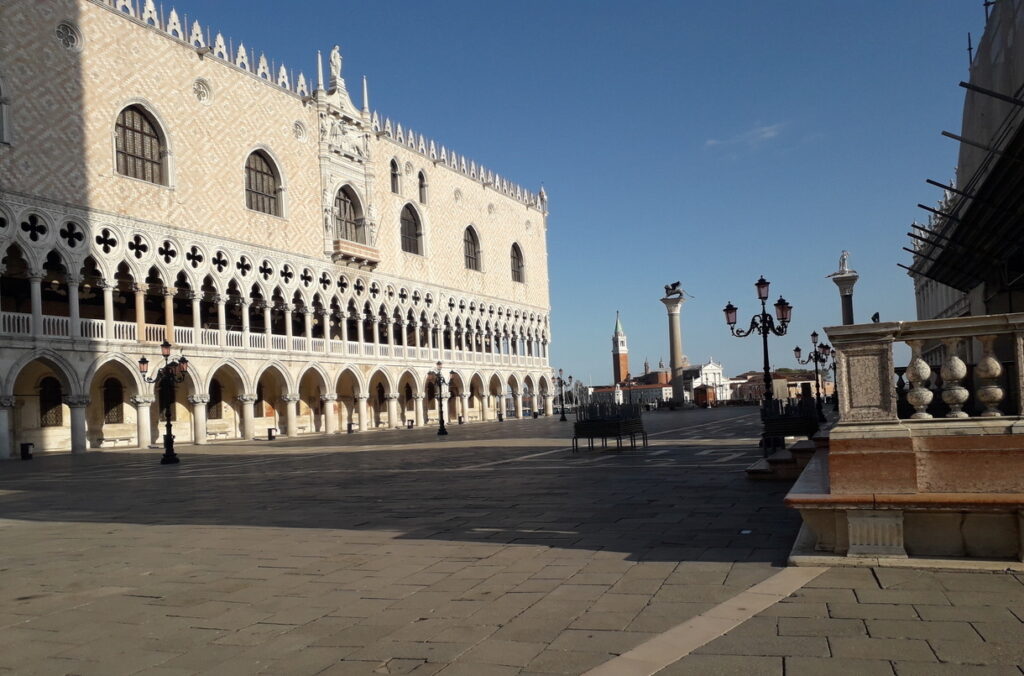
An empty Piazza San Marco during Italy’s coronavirus lockdown, | © Nico Ventura, 2020
Before the canceled flights and quarantine, the streets of Venice were overwhelmed with 30 million tourists a year. The historic sites were so choked with crowds that people are no longer allowed to sit the steps in Piazza San Marco. In the book If Venice Dies, Italian art historian Salvatore Settis describes his fear that the lagoon city will lose its soul if this trend continues.
“For our modern communities, oblivion doesn’t simply mean forgetting one’s history…It primarily means forgetting something essential: the specific role that a city plays in comparison to others, its uniqueness, and its diversity, virtues that Venice possesses more than any other city in the world.”
Salvatore Settis, If Venice Dies, 2014
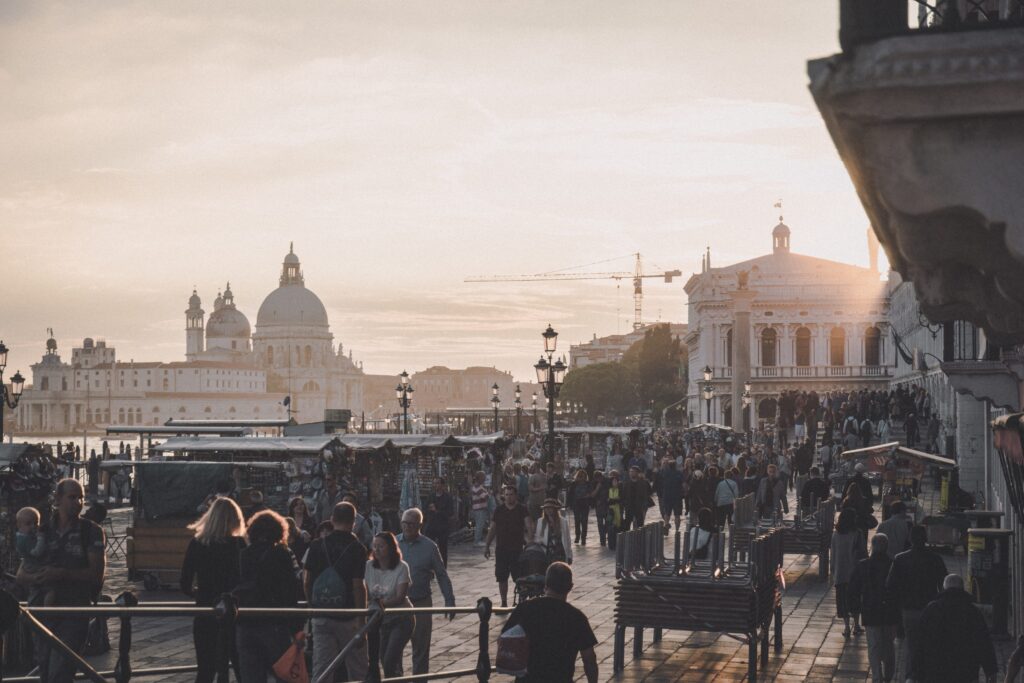
Settis describes that loss of identity in Venice as a “tourist monoculture.” Tacky souvenir shops, short term rentals, and English menu boards outside restaurants are the symptoms of this tragedy. He writes, “A city and its people are a single unity, a hub that links the experience of the living with the memory of material objects” (Settis 2014).
The shiny plastic masks that line shop windows in the city’s main arteries show a stronger link with tourists than Venetians themselves.
The Riva degli Schiavoni, a wide promenade along the waterfront in Venice with plenty of souvenir stalls | © Jiakun He, 2018
The number of permanent residents has dropped steadily since the end of World War II when the city used to have more than 170,000 inhabitants. The last time the city’s population experienced a similar severe decline was after the 1630 plague. Before the 2020 COVID-19 emergency, tourism was the epidemic driving citizens out of Venice.
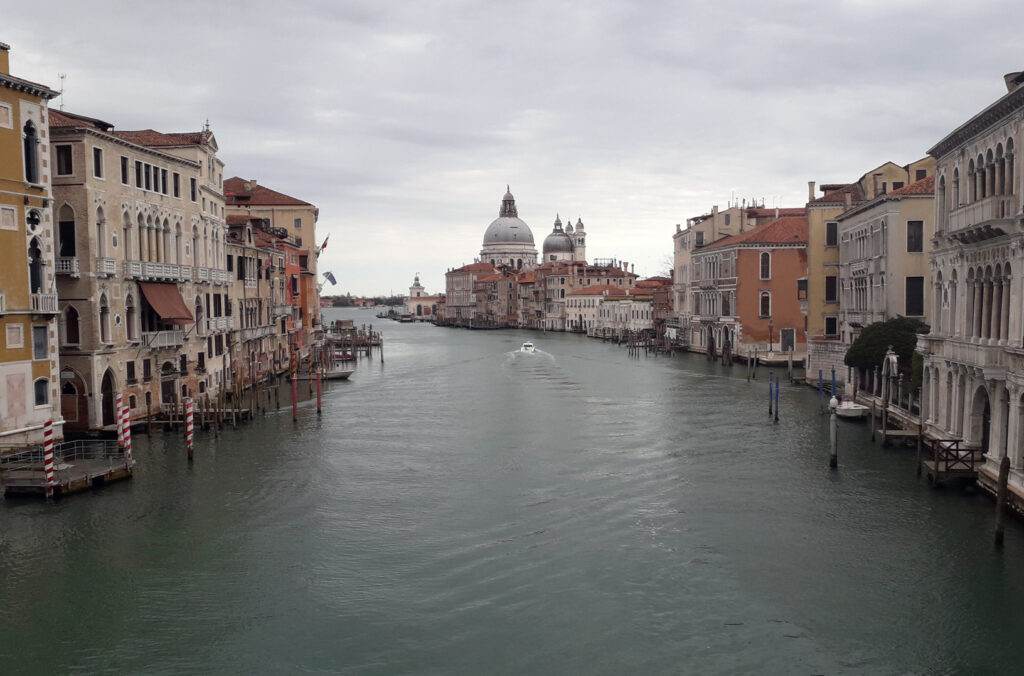
Today, the novel coronavirus is keeping residents locked in their homes. The city is experiencing a massive reset. While viral social media posts of dolphins in the Venice canals are false, the canals are cleaner than in recent memory.
The streets are empty. The souvenir stands are shut. This crisis presents a unique opportunity to examine how tourism was changing the heart of Venice and propose a refresh post-COVID-19. In the pain of quarantine and frustration with the unknown, we can look towards a new beginning.
A deserted Canal Grande during COVID-19 Italy’s lockdown | © Nico Ventura, 2020
Life in a Shrinking City
The historic center of Venice is divided into two conflicting worlds. In the first, residents shop for groceries, meet friends at cafes, and attend school. In the other, visitors flock from across the world to buy souvenirs and take selfies on bridges. This section will examine the population and housing occupancy trends impacted by this dynamic.
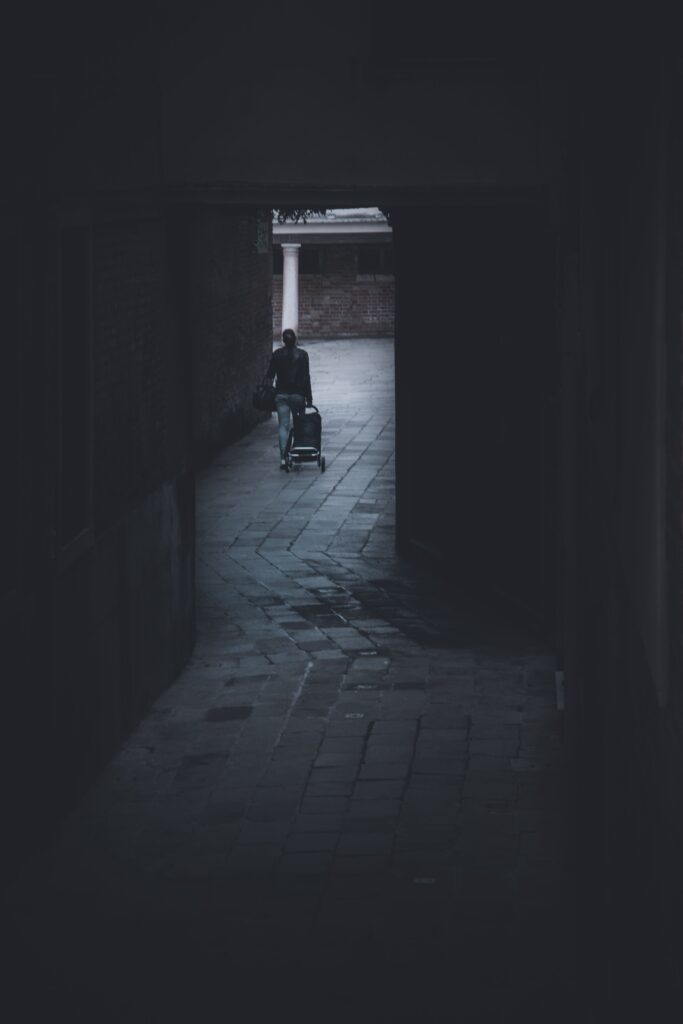
A typical Venetian alley: a dark, narrow passage about to open into a square. The pedestrian seems to be drawn to the light beyond the passage | © Jiakun He, 2018
///
The municipality of Venice actually includes over 100 islands, an entire lagoon, and the industrial mainland city of Mestre. This project focuses on Historic Venice, the island of canals and gondolas that most people associate with the name Venice. The historic city center faces distinct infrastructure and tourism-related challenges from the more rural lagoon islands and Mestre. Residents, however, lack the self-governance to concentrate resources on these needs. While the historic city tried to gain independence in a failed 2019 referendum (deemed invalid due to low voter turnout), Venetians are still lumped into a city budget with the rest of the enormous municipality. Despite the legal municipal boundaries, the unique character of the built environment and tourism industry in historic Venice make it a stand-alone case study.
Read about our research methods here.
In order to mitigate the issues of using irregularly shaped census tract polygons and to aggregate incident point data, we normalized the geography of our area of analysis. A hexagonal tessellation covers the historic city center of Venice (5 km wide and 3 km from North to South, including Giudecca island). We split this region into a grid of 1642 hexagons. Each has an area of 5,200 square meters, 0.5 hectares, or 1.3 acres depending on your preferred unit of measurement. The hexagons measure 90 m across, with a 45 m radius.
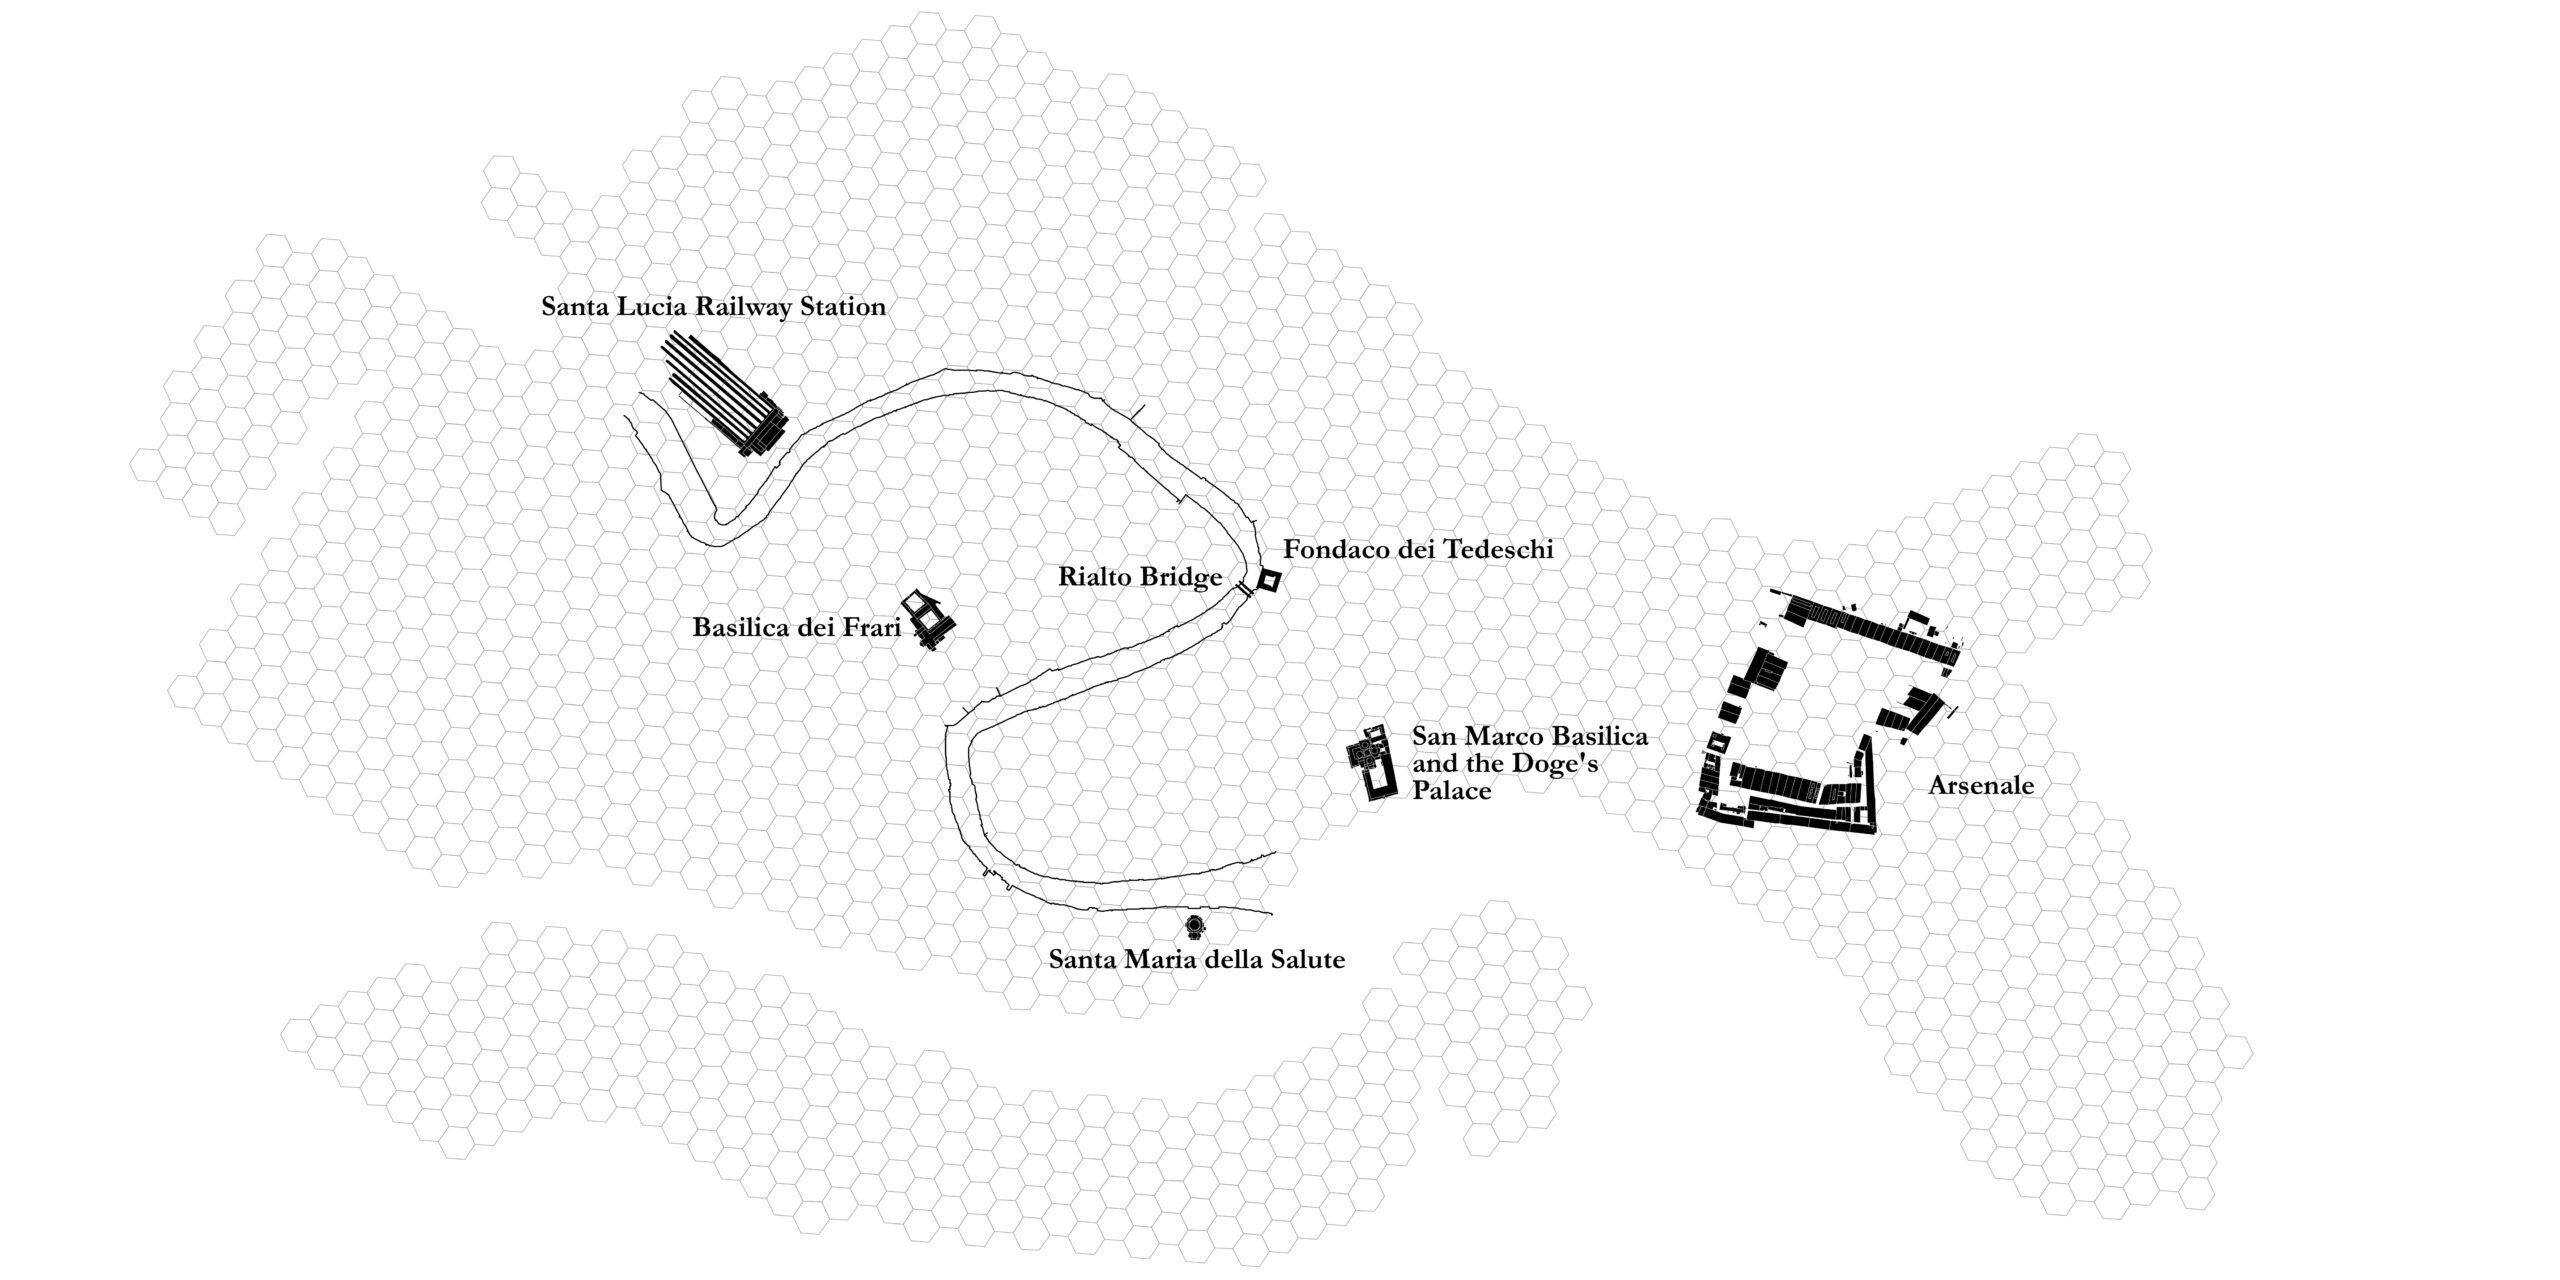
Why Hexagons?
There are two main reasons to use hexagons:
- Hexagons reduce sampling bias resulting from the edge effects of the grid shape. This works because of the low perimeter-to-area ratio of the shape of the hexagon. A circle has the lowest ratio but cannot tessellate to form a continuous grid. Hexagons are the most circular-shaped polygon that can tessellate to form an evenly spaced grid.
- Hexagons are preferable when the analysis includes aspects of connectivity or movement paths. This is because the distance between centroids is the same in all six directions.
Read more in “Why Hexagons?”
What’s the Right Hexagon Size?
To determine the size of our hexagonal grid, we identified the most densely populated point dataset used in the project – Airbnb listings from January 2020. Cell size distance should be twice the larger of either the average or the median nearest neighbor distance. The average nearest neighbor distance (ANN) for all of the unique location points, excluding locational outliers, is computed by summing the distance to each feature’s nearest neighbor and dividing by the number of features (N). The median nearest neighbor distance (MNN) is computed by sorting the nearest neighbor distances smallest to largest and selecting the distance that falls in the middle of the sorted list (also excluding locational outliers).
Read more in “How Average Nearest Neighbor works?”
Based on this analysis, we determined the ideal hexagon size for our purposes: 90 m diagonal with 0.5 hectares area.
Population Change and Unoccupied Dwellings
Residential life is phasing out in Venice. The exodus of locals from the historic city center is best visualized with population data from the Italian National Institute of Statistics (ISTAT). Play with the toggles in the interactive map menu below to see the shift from 1991 to 2011. The map also illustrates an increase in non-resident owned dwellings with data from the same source. This includes any housing that is empty or not owned by its occupants, mostly used for short term rentals to tourists. The city is emptying out, and the buildings are becoming hollow in the residents’ wake.
Both factors are classified with natural breaks in order to make the groups as distinct as possible. As you toggle from 1991 to 2011 population in the interactive map, dark pockets of red – indicating densely populated areas – fade to muted orange. For example, the maximum population in a single hexagon drops from 227 in 1991 to 183 in 2011. In 1991, there is only one hexagon with 25 unoccupied units. By 2011, there are 36 above 25, and one hexagon with a startling 43 unoccupied dwellings in the San Marco neighborhood.
Grocery Stores, Schools, and Transit
As the tourist industry boomed, amenities for permanent residents became scarce. The Associated Press reports that as the local population leaves, “the social fabric of the city wears, the number of neighborhood stores offering staples dwindles — as do public services.” It’s a positive feedback loop – the fewer locals there are to shop and attend school, the fewer shops tailor to long-term residents. The more tourism dominates the local economy, the more Venetians move to Mestre or beyond.

A group of kids play at the footsteps of Santa Maria dei Miracoli in Cannareggio, where the church’s polychrome marbles meet with the water of the canal | © Jiakun He, 2018
///
The next map shows grocery stores, schools, and public transit in the city. You can view the names of each feature by hovering over them with your mouse. You can also see a dense cluster of grocery stores in the center of the city – that’s the Rialto Market, a large open-air collection of stalls with fresh produce and fish. The map also shows a network of academic buildings owned and managed by the IUAV University of Venice and Ca’ Foscari University.
Tourism Index
This section considers the first research question – how to measure tourism saturation on a small scale. The “Tourism Index” will take into account three main variables – Airbnb listings, TripAdvisor restaurant reviews, and Google POI data for tourist-focused enterprises. This data is compiled into a map identifying hotspots of intensive tourist activity and services.

The interactive map below shows tourist-focused shops layered over Airbnb listings from January 2020, before the pandemic struck Venice. Red Airbnb bubbles’ size reflects the number of guests that each listing can accommodate. We used an exponential function to index the sizes in order to emphasize Airbnb properties with larger capacities. There are 6642 total listings in the historic city, able to host up to 16 guests. The most common number of people allowed to stay at a listing, however, is 1.
You can toggle various types of tourist-oriented stores on and off in the bottom right-hand menu. If you want to look at the restaurant review distribution, you can select “Restaurants” there as well.
The size of each of the 997 restaurant bubbles corresponds to the enterprise’s internationality score, explained in the “Variables” section. An exponential function was also used here to highlight those with higher scores. You can notice a denser concentration of restaurants with high internationality scores in the San Marco neighborhood. There are also more high-capacity Airbnbs, designer stores, and mask shops in that area. The outskirts of the city, including the island of Giudecca, have fewer of these tourist-orientated stores.
Variables
Airbnb
Airbnb is a popular web-based platform used to rent single rooms or full apartments/homes on a short-term basis. The Airbnb industry disrupts the local housing market by reducing the number of units available for longer-term renters. Airbnb claims on its website to help local entrepreneurs, “monetize their spaces and their passions while keeping the financial benefits of tourism in their own communities.” When hosts buy up multiple properties to rent year-round, however, they drive up the cost of living for permanent residents. The financial benefits for individual hosts do not translate to community-wide empowerment.
The examples below highlight some examples of Airbnb listings which reduce housing availability for Venetians.
Career Host
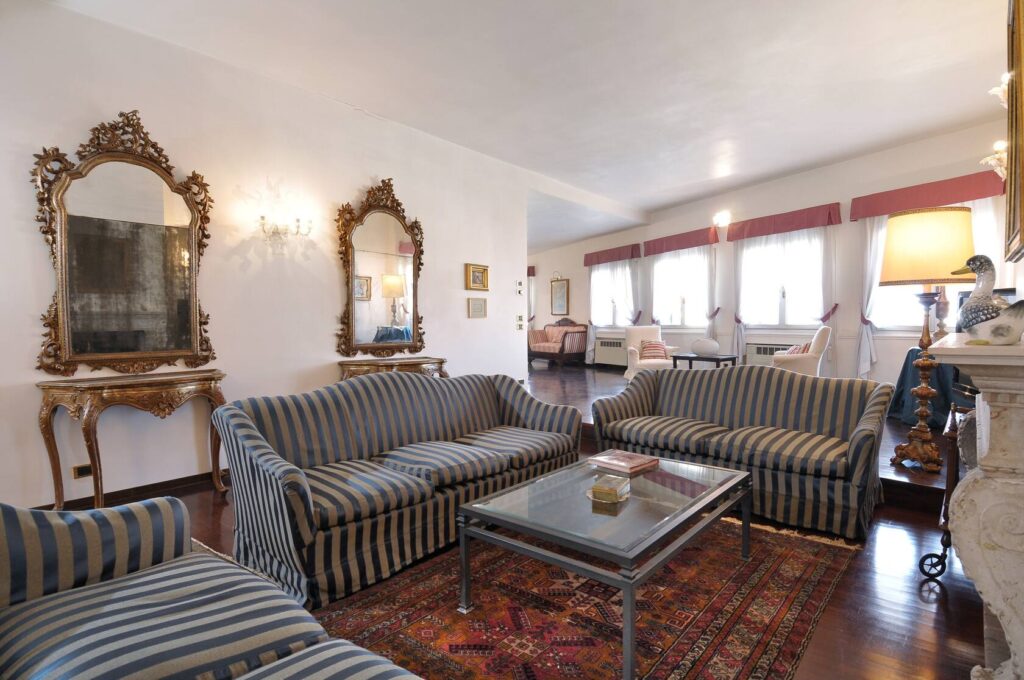
“Views on Venice” bought up over 90 apartments in the lagoon city according to their website, with 77 listed on Airbnb in January 2020. This company has been around for over 20 years and allows bookings through their own platform. Airbnb is just another way to advertise their properties to travelers.
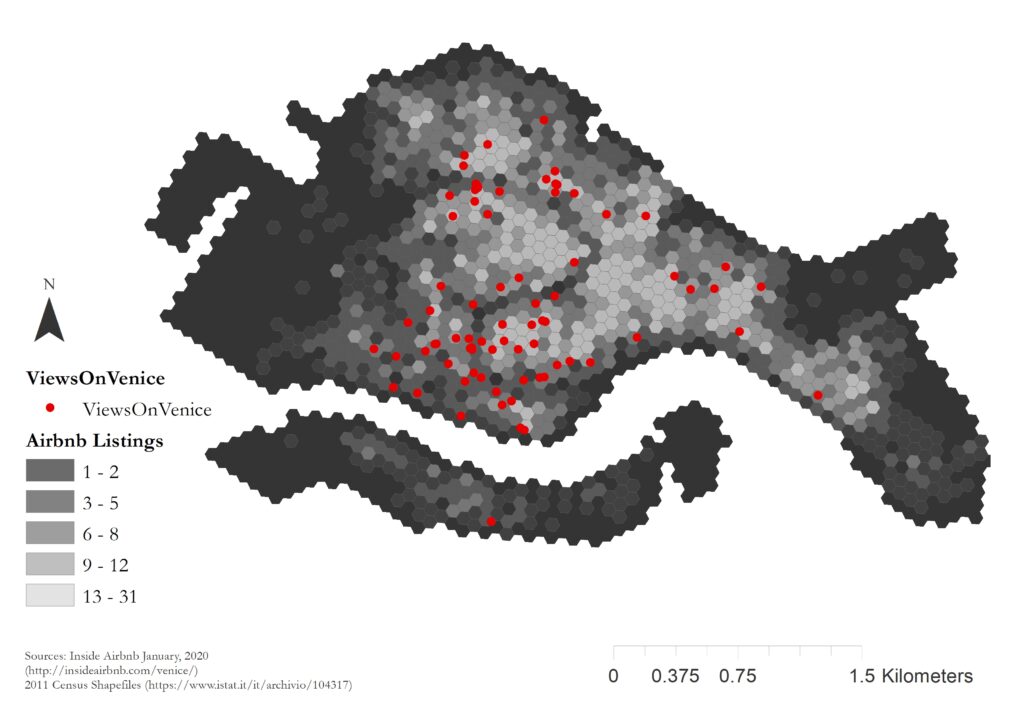
Views on Venice Airbnb listings over total listing density map – January 2020
Stay All Year
Airbnbs aren’t just for renting out your spare room when the kids are away at university. Take this “Airbnb Plus” listing – a “Historical Luxury Apartment on Calm Sunny Canal.” The “Plus” designation means that the property was inspected in person for impeccable design. Hosts Marc and Elisabeth rent their entire three-bedroom, three-bath apartment to up to six guests at a time. The listing is available 351 days a year as of January 2020. While the home makes for a gorgeous stay, that’s one less property for available for year-round Venetian residents.
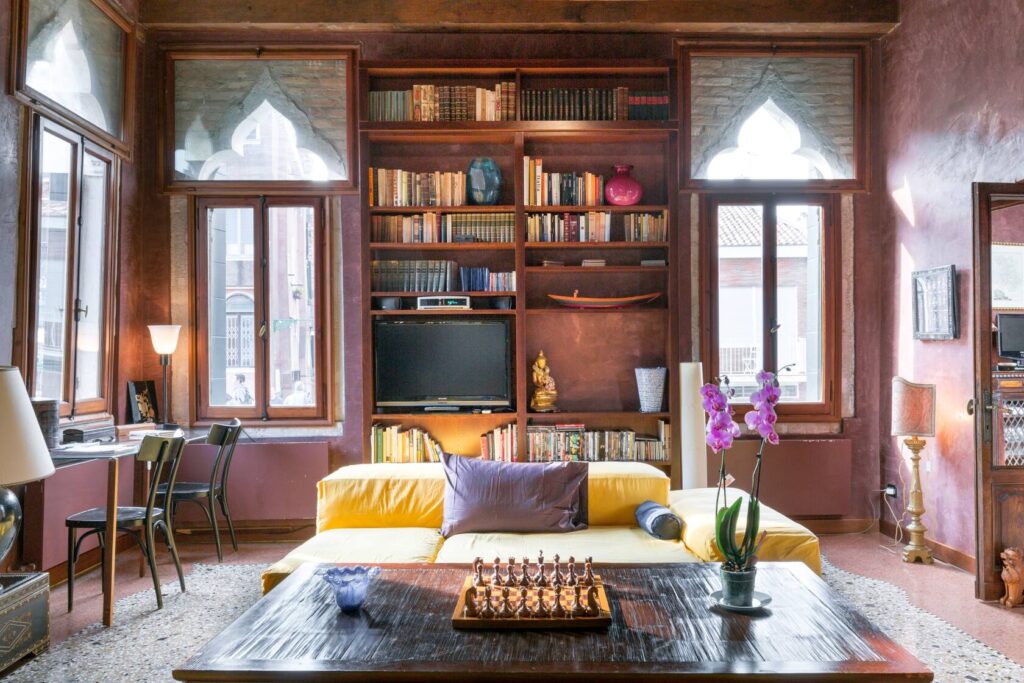
We sourced data from Inside Airbnb, an “independent, non-commercial” project which consolidates Airbnb data from cities around the world. They scrape the Airbnb website each month and compile all publically available data at the individual listing level. We pulled listing locations and maximum number of guests per listing to visualize the short-term rental landscape.
Trip Advisor: Restaurants
To compile a restaurant review dataset, we used TripAdvisor data such as restaurant name, total review count, language review distribution, average rating, price range ($ signs and minimum/maximum price, if listed), keywords (such as the style of cuisine), and address.
Before processing the data to quantify restaurants’ international reach, we geocoded the listings using the Google Geocoding API. We removed restaurants that either no longer exist or fall outside the boundaries of the historic city. As a final step, our team manually fixed the location of restaurants with duplicate coordinates. This both increased the precision of restaurant locations and ensured the accuracy of our spatial indicators.
Internationality of Restaurants
There are two metrics for restaurant internationality, in each cell of our hexagonal Venice. The first is the percent of reviews by Italian natives or Italian speakers. This includes all reviews written in Italian, as well as all English reviews where the hometown of the reviewer is listed as “Italy” or “Italia”.
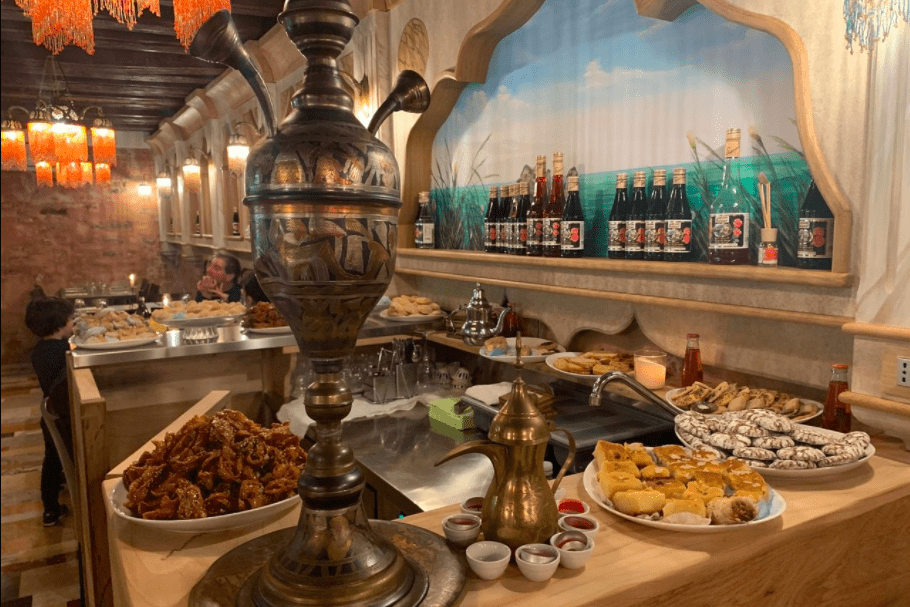
One restaurant that scores high on this metric is Gibran, an Italian-Lebanese restaurant in the Castello neighborhood. Gibran had 34 Trip Advisor reviews as of May 2020, with 94.11% from Italians. One American reviewer wrote that, “It’s tricky to eat in Venice with all the tourist traps (and ridiculous $), and this was one of the best meals we had on all measures.”
Photo provided by management (Feb 2019).
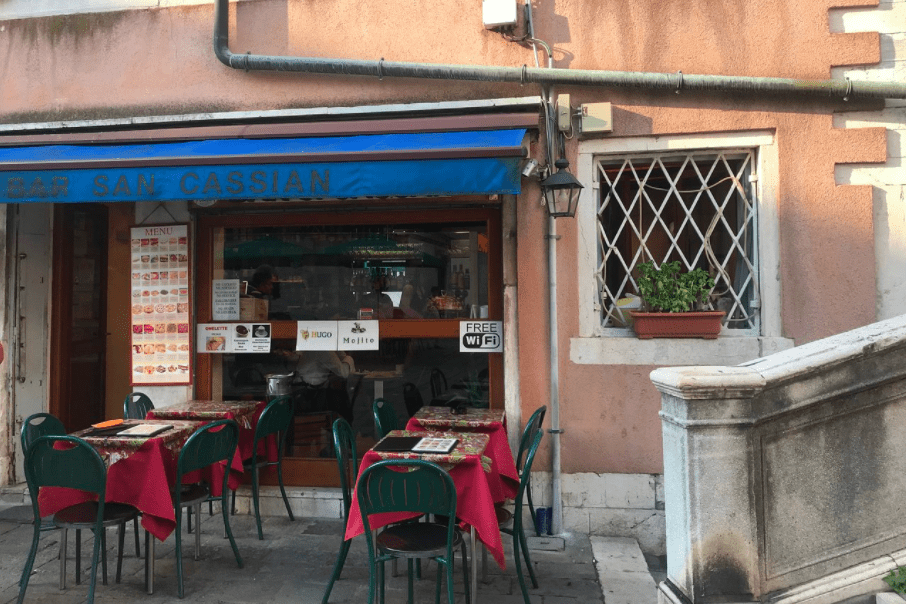
On the other end of the spectrum is Bar San Cassian, which gets the prize for the lowest percent Italian reviews in our dataset. The cafe’s Trip Advisor listing has just 3.08% Italian reviewers. Pictures posted by patrons show off a menu with photos, an advertisement for free Wifi, and an English reminder that you can’t get service without paying a cover fee. Bar San Cassian is the epitome of a tourist-dependent business located just off the Grand Canal.
Traveler photo submitted by Yoitomake (Feb 2020).
The second measure of restaurant internationality is the Homogeneity Index. This metric is the probability that any two randomly selected non-Italian reviews are written in the same language. Formally:

The Homogeneity Index is always a number between 0 and 1, where values closer to 0 mean that there is a lot of diversity in non-Italian language distribution for that restaurant. Values closer to 1 indicate a high degree of language homogeneity in a restaurant.
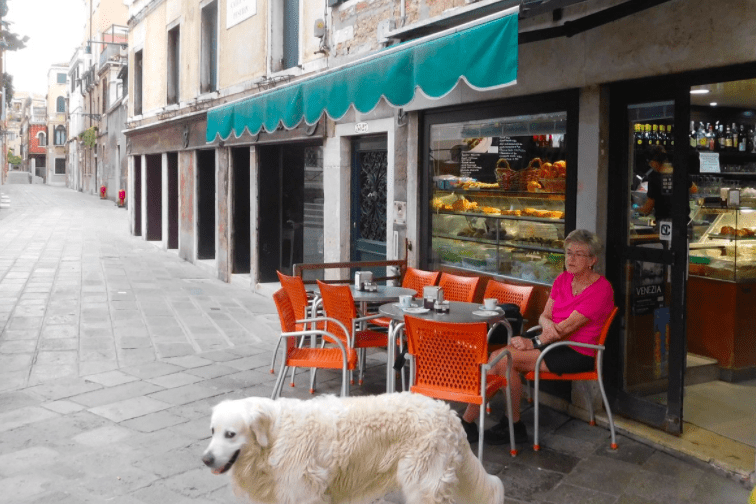
Bar Spritz, a cafe and wine-bar with eight reviews, is one of the most diverse. It has one-quarter Italian reviews, but a homogeneity score of 0.6. Their TripAdvisor page featured reviews in English (“Relaxed atmosphere and the food looked fab.”), Chinese, Finnish, French, German, and Italian! Apparently the cafe’s early opening time and friendly service draw a diverse crowd.
Traveler photo submitted by syw1023 (Apr 2019).
The homogeneity index metric is multiplied by the percent Italian reviews to get a diversity-weighted percent Italian value. Now, values closer to 1 mean that the restaurant is very Italian and not diverse in its non-Italian reviews. Values closer to 0 imply that the restaurant is very international and diverse in its international reviews.
The internationality score is calculated by taking the inverse of the log of this measure to normalize the distribution. Each hexagon is labeled with an average value, weighted by the number of reviews for each restaurant.
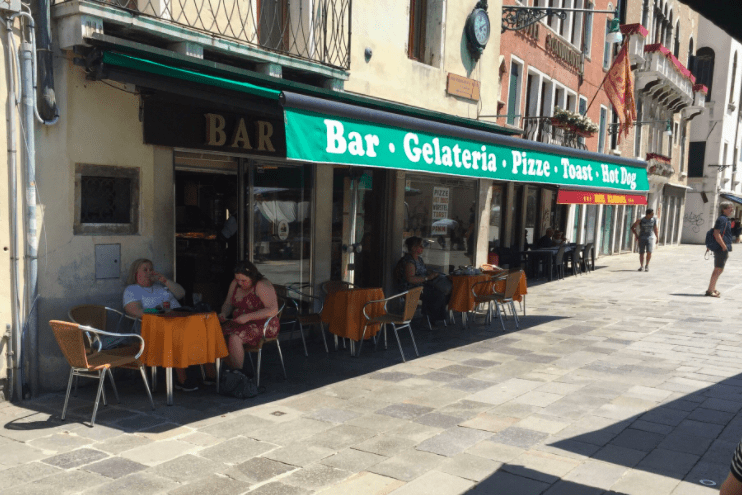
TripAdvisor reviewers for All’Orologio are about as international as it gets. This cafe and pub west of the Grand Canal has a 4.47 internationality score and 1.5 out of 5 TripAdvisor rating from customers. Apparently it’s a place where foreign visitors and overpriced fare meet. The reviews disparage the food, service, and value in six languages.
Traveler photo submitted by Makothe (Jul 2017).
[wptripadvisor_usetemplate tid=”1″]
Google POI: Stores
From a pedestrian’s point of view, certain areas of the city seem to host a large concentration of luxury stores, such as Gucci or Dolce and Gabbana. T-shirts bearing gondolas and 2-for-1 deals on postcards are ubiquitous. Four prime examples of these shops that cater to large crowds of visitors are designer stores, jewelry shops, souvenir shops, and mask stores (images clockwise from top left).
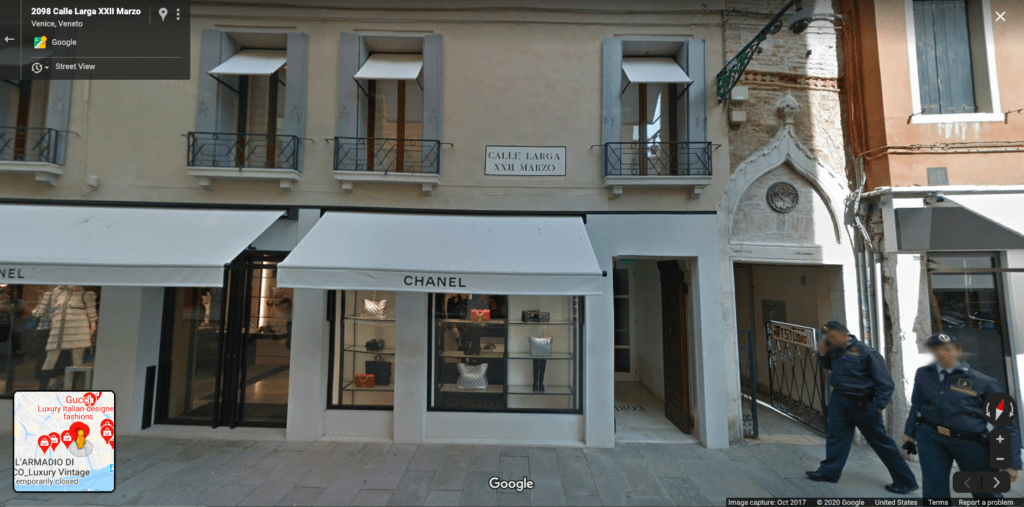
Designer shop (October 2017)
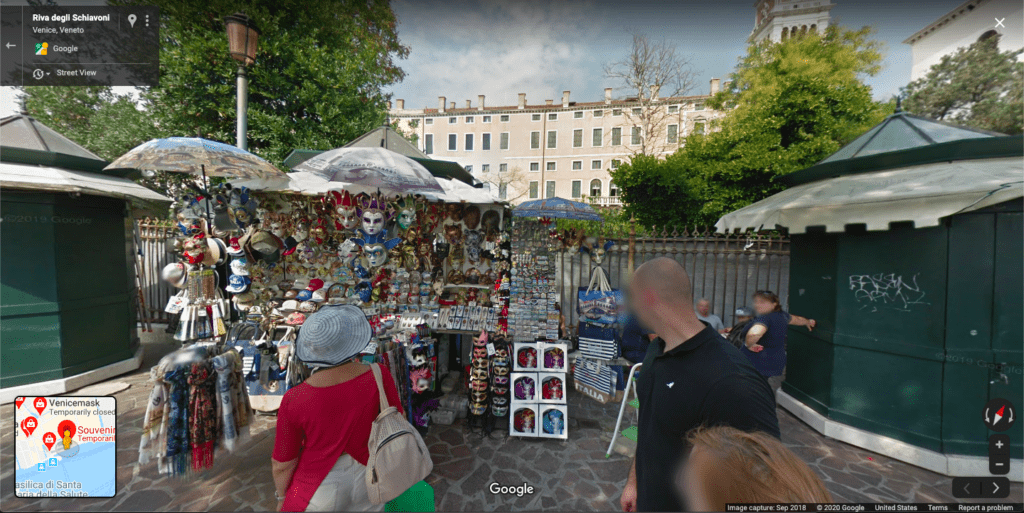
Mask store (September 2018)
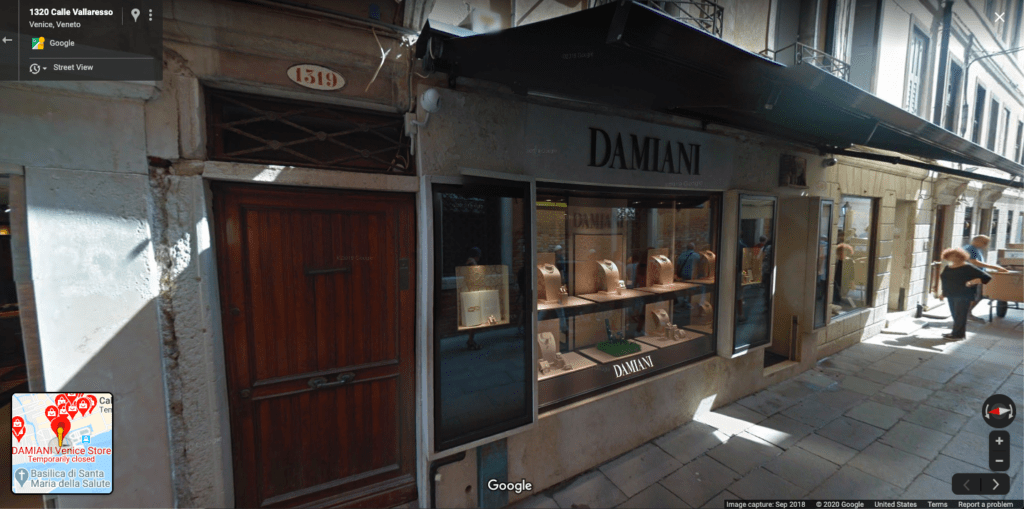
Jewelry store (September 2018)
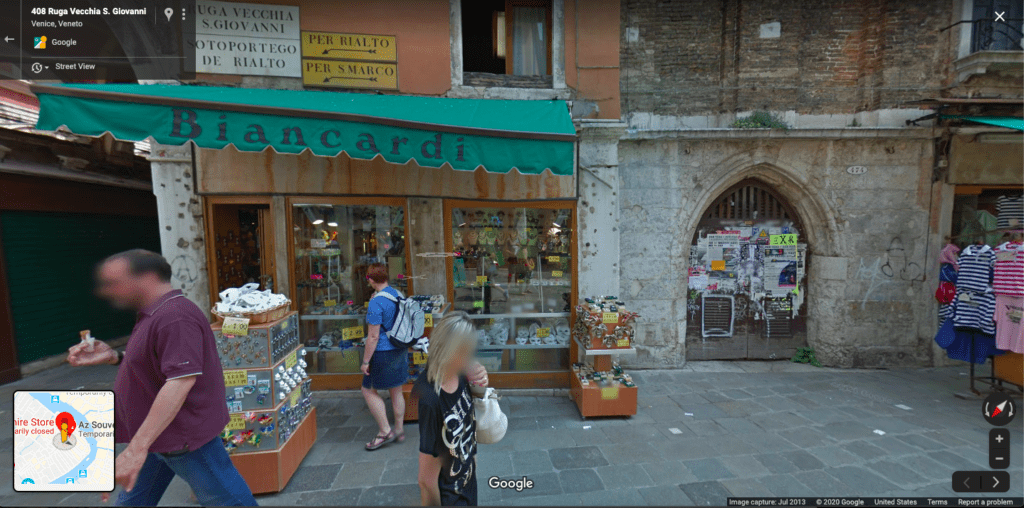
Souvenir shop (July 2013)
Information about the locations and popularity of these stores comes from the Google Places API. Scanning all of Venice, we use Google Maps to return stores that match each description. The store count is summed to get the total value per hexagon.
Constructing the Tourism Index
Our final tourism index value calculates the average standard deviations from the mean of the following variables, where we have information on them: the number of designer, jewelry, mask, and souvenir stores, the total number of Airbnb beds (number of Airbnb listings times their capacity), and the internationality index. We omit hexagons with no data.

The next interactive map shows the tourism score in each hexagon, colored by standard deviations from the mean. The maximum score is 7.54, while the smallest is -0.38. The highest tourism index is predictably in the San Marco neighborhood. In the bottom left corner, there is a tab to toggle to the internationality index, which is normalized from 0 to 1. These scores were categorized with natural breaks (Jenks) in order to minimize the differences within each color grouping. The final tab shows the total number of Airbnb beds in January 2020. The densest hexagon has 31 beds in just that 0.5-hectare piece of land. Airbnb beds were also classified with natural breaks (Jenks) to show distinct groupings of similar hexagons.
Findings
We demonstrate the validity of the Tourism Index through its correlation with changes in unoccupied housing. To determine this, housing data are included in a regression and outlier cells (more than 3 standard deviations from the mean) are excluded. We find that 1 standard deviation change in the tourism score predicts a 3.5 percent increase in unoccupied housing, controlling for the percent of built land in the cell and neighborhood.
Unoccupied housing changes are based on records from the last Italian census in 2011. Airbnb, Trip Advisor, and Google POI data are all from 2020, nine years later. While it is safe to assume that unoccupied housing and population trends are consistent with the steady stream of tourism over the last decade, this analysis will be more up to date when the 2021 census is released.
The plot below shows the predicted values for the tourism index against the predicted values of unoccupied housing, given the neighborhood and percent water for a given area. Then, after we control for those factors, we fit a line through the points shown to see how unoccupied housing varies by the tourism index (given neighborhood and percent water). This shows us the effect of adding the tourism index to a model that tries to predict unoccupied housing only using the neighborhood and percent water data for each hexagon.
The Tourism Index can be used by the municipality to identify small pockets of intensive tourism activities. The granularity of this study allows for targeted intervention. One possible application could be limiting the number of souvenir shop licenses in areas with a high Tourism Index score. The city could also advertise cultural points of interest in less “touristified” areas, inviting visitors to discover some lesser-known museums. Having more visitors in local museums or cultural points is not a problem. The real challenge remains how to avoid the touristification of the city’s streetscapes while allowing locals to enjoy their historic center. Bringing visitors to these outlying landmarks will not disrupt residential life if the city limits licenses for tourist-focused amenities there as well.
Streets: Where the Two Halves of Venice Meet
There is no greater public mixing pot than the city sidewalk. In The Death and Life of American Cities, Jane Jacobs writes about the trust that builds up in a community with “sidewalk contact.” When eyes meet at a street corner or a regular chats with their barista about the weather, the neighborhood becomes interconnected.
Before the pandemic, Venetian streets were brimming with sidewalk contact. No one is isolated in cars, and the narrow alleys force pedestrians to negotiate right of way. Although they may spend their time in different parts of the city, tourists and Venetians’ best chance of colliding is in the streets.
This project is far from the first effort to qualify the Venetian urban form. Famed American urban planner Kevin Lynch visited the city between 1952-53 and wrote a detailed travel journal. Lynch described Venice as a city that should only be studied at eye level. He wrote,
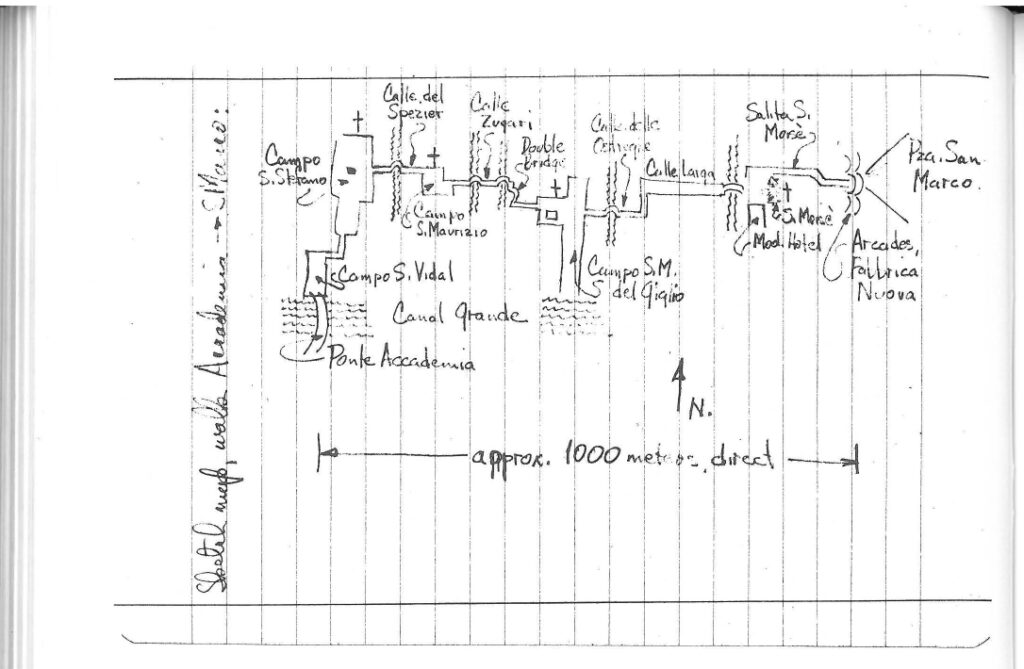
“From above Venice a dense network of roofs, have no idea of presence canals and squares. A city not made for the air view, but the close ground view…Best of Venice [is] really in its pedestrian ways, the big open squares, the irregular footways, the people, the buildings and storefronts scaled to the pedestrian.”
Sketch map, walk from Academia to San Marco (April 19, 1952) – City Sense and City Design: Writings and Projects of Kevin Lynch
Understanding the relationship between this eye-level urban form and the people who walk through it is key to identifying the tourism hotspots, where local culture has given way to garnish consumerism. This is the first step towards regulation of the problem. Urban planning policies targeted towards specific typology will be more effective than an ad-hoc regulation system based on administrative boundaries.
The following section identifies which aspects of the built environment predict the tourism index. A range of different variables are at play. First, we will look at landmarks, street width, public spaces, and public transit one by one. Then, we’ll examine their total interactions to find their relative importance.

Urban Form Parameters
The tourism index alone neglects to capture the tangible experience of walking down a Venetian street. In order to predict areas of high tourism density, we compiled data for key aspects of the urban form. Use the arrows below to read further about each element of the eventual regression analysis. The data for this section comes from dati.venezia.it.
[smartslider3 slider=”2″]
The following map shows landmarks from Google POI, street shapefiles from dati.venezia.it, and % open space per unit of analysis. You can make the streets invisible by clicking their tab in the upper left corner. This will give a clearer picture of open space. The average amount of land without buildings is 11% with a maximum of 91% in Santa Croce, close to the train station. Open space was categorized with natural breaks (Jenks), and the landmarks are sized by their popularity. Rialto Bridge has the most reviews by far, at 98,500. For comparison, the mean is just 1,000 reviews.
Regression
Here is our regression equation, where i indexes hexagons, j indexes neighborhoods, and Neighborhood_j is a dummy that equals 1 when hexagon i is in neighborhood j.

Both the average and maximum street width change have a significant positive relationship with the tourism score. For instance, a 1000% increase in average street width changes, typical of adding a public square to a hexagon, would predict an increase in the tourism index of .2 standard deviations. The relationship across the city is not consistent. The metric is more predictive in San Macro than in Sat’Elena, where there is actually a negative effect from street width change.
Features of the built environment, including street width change, distance from public transit, and landmarks are highly correlated with our tourism metric. Public transit and infrastructure have the opposite effect: more “touristified” areas appear to be those farther from public transit, even when controlling for land/water ratio. This might be explained by the fact that most of the popular Venetian public spaces are not served by vaporetto stops. In fact, Venetian piazzas (campi) are usually located in areas where narrow canals do not allow public transit circulation.
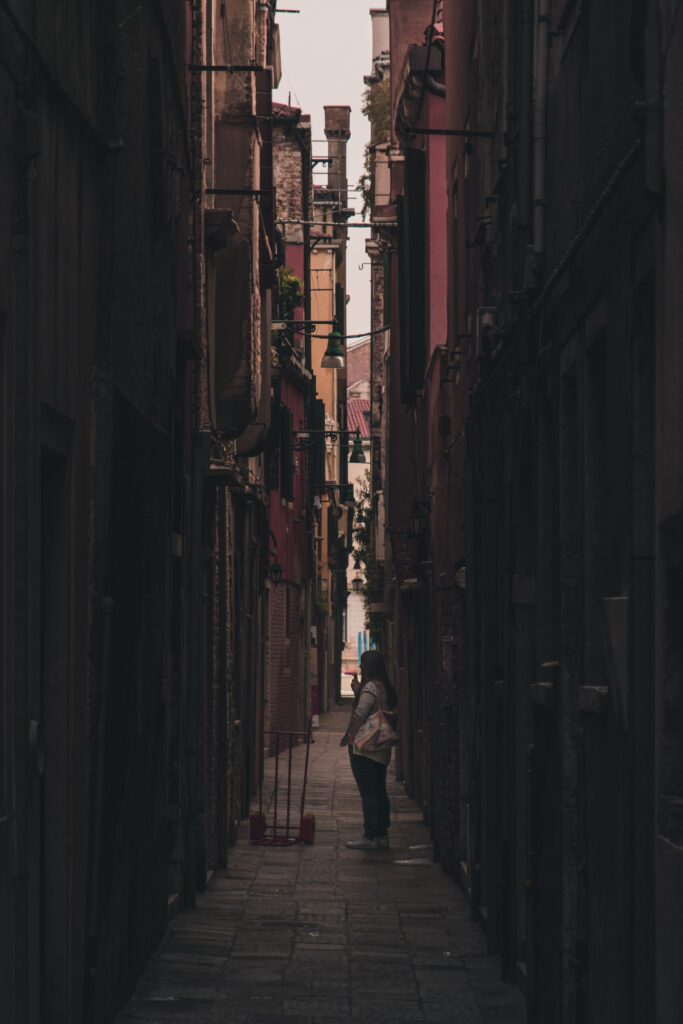
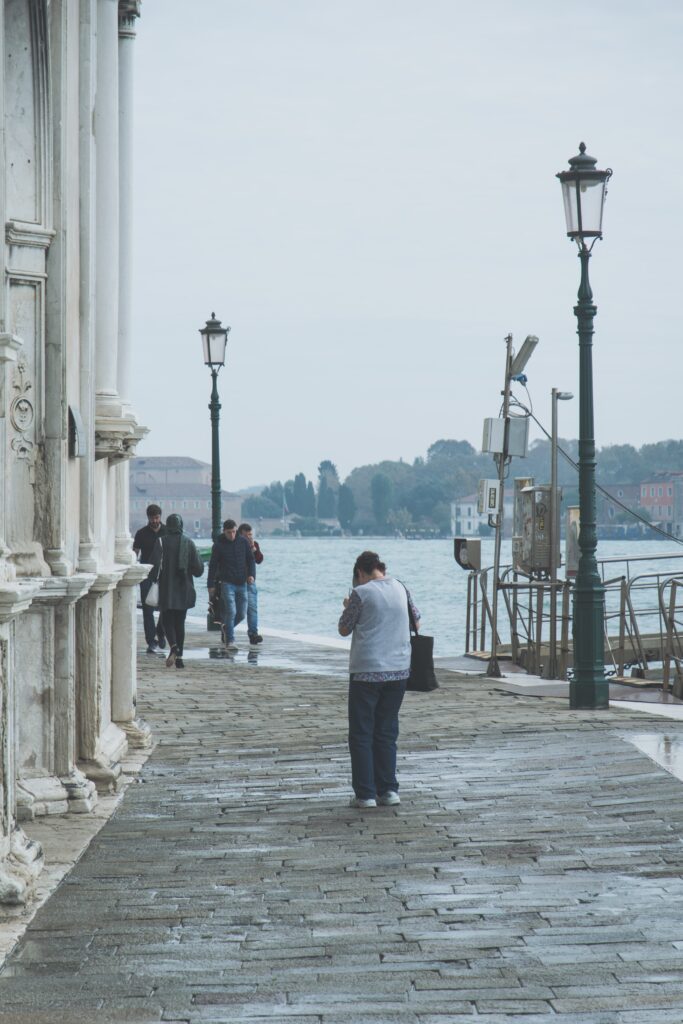
These images exemplify the variety of streetscape conditions within the historic city center of Venice: on the left-hand side, a 2 meters wide alley is squeezed by colorful residential buildings; on the right-hand side an 8 meters wide waterfront walkway is bounded by the white marble of a church and by the water of the lagoon | © Jiakun He, 2018
///
In general, the distance from vaporetto stops to the centroid of each hexagon predicts an increase in the tourism score, controlling for the water to land ratio in each cell.
Through this analysis, we see that aspects of the built environment, including street width change, distance from public transit, and landmarks are good predictors of where tourists will locate. These factors vary widely by neighborhood. In some neighborhoods, landmarks or street change have the opposite effect. Even the strongest determinants of tourism – landmarks – do not evenly attract tourists to different parts of the city. This stresses the necessity of context-specific analysis and policies: our analysis also shows that tourists are likely to flock to already touristified areas. These nodes, such as squares and landmarks, can be more carefully regulated to reduce tourism pressure.
Finally, we consider the relative impact of each index against each other, which reveals the robustness of our vaporetto and landmark effects.
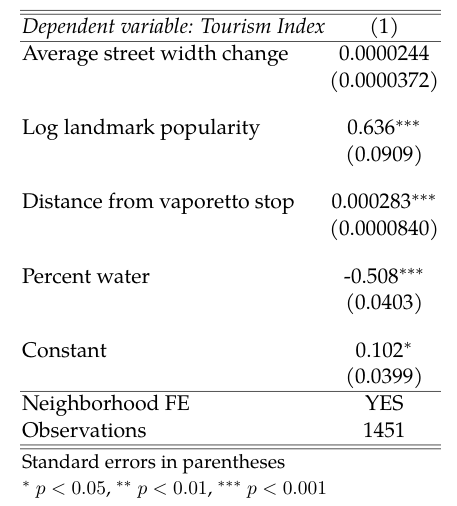
More tables demonstrating regression results are available in the appendix.
Policy Recommendations
Venetians deserve a city that balances residential needs with a more sustainable tourism industry. We suggest that local decision-makers regulate tourism on a micro-scale to dilute intensive tourist activity. Our Tourism Index metric can identify these high-risk areas at a granular scale of investigation. With this tool, the built environment and pre-COVID tourism conditions can inform context-specific policies, relying on spatial typologies rather than ad-hoc boundaries.
New souvenir shops are already banned from opening near San Marco and Rialto based on a July 2019 resolution approved by the Municipal Council of the Lagoon. In order to preserve the cultural heritage of these sites, the council limited new shops to artisanal and high-end retailers from designer clothing stores to art restoration. This micro-regulation around the most touristy sections of the city should be expanded to other threatened areas.
While the city considers luxury goods and art galleries key to protecting and enhancing culture, emphasis on these commodities raises the question of which tourists get to enjoy Venice. Will the city reduce its theme-park likeness only to price out students or budget travelers? City officials and residents alike must contend with who tourism restrictions exclude. A burst in fancy watch stores may just draw in wealthier crowds. We suggest that more energy is directed towards drawing in business for and owned by locals like grocery stores, bookshops, and quality cafes.
Our analysis suggests that policymakers should watch for over-touristification at the entrances to public squares from narrow streets. By defining special zones around such high-danger areas, policymakers can prevent an uncontrollable follow-on tourism effect. Context-based zoning could be used to only allow sustainable businesses in these risky areas, targeting “slow tourism” or the needs of residents themselves. The 2019 resolution restricted tacky souvenir displays attached to window frames or doors; this method of preserving a historic streetscape is essential at these corners where pedestrians pause to reorient themselves.
When adding new cultural attractions like Biennale art galleries, policymakers must consider the spillover effects. Since landmark popularity determines tourism values, we can predict the expected change from “adding” another landmark based on its surroundings. Our neighborhood-by-neighborhood analysis establishes a threshold for when such changes risk negative effects. We suggest using these thresholds as a normative upper-limit for tourism values for the Venitian sestieri (neighborhoods) – a baseline to limit souvenir shops and Airbnb rentals.
Using synthesized and spatialized granular data, policymakers can make choices about where to advertise new cultural attractions. For example, they can advertise and incentivize visits to museums off the beaten path to attract more visitors. Meanwhile, they can protect the socio-economic fabric of the surrounding streets by allowing universally beneficial shops like pharmacies to open alongside traditional crafts. Local civic groups are asking the city to provide tax incentives for new artisanal shops. With a tourism index, the city can target areas that were home to pre-COVID tourist traps for this return to the city’s traditional exports.
Conclusions
I. How can we construct a “Tourism Index” that detects areas of “tourism saturation” at a granular level by taking into account the complex socio-economic fabric of the city of Venice?
The final tourism index considered Airbnb prevalence, the internationality of restaurants, and stores targeted at visitors. This index can be used by local authorities to make policy informed by local conditions, rather than sweeping reforms. It is no great surprise that the San Marco neighborhood and Rialto Bridge area scored highest. These are the most iconic areas of Venice – visitors can’t leave the city without snapping a photo. What might be of more interest is how to disperse the commercial intensity of these spots. We identified the problem areas. The next step is to figure out how to prioritize the needs of locals based on this information.
II. What’s the predictive power of urban form parameters (such as street width, landmarks, public spaces) to explain the Venetian tourism-city relationship?
In areas already overwhelmed with tourism, like San Marco, changes in street width and landmark popularity are strong predictors of tourism hotspots. This indicates that should tourism “spread out” to other areas of the city, it is likely that similar nodes of intensity would form near public squares and landmarks. As Venice seeks to diversify its economy and avoid zones overwhelmed by tourist infrastructure, planners should look at these existing challenges.
The built environment not only determines the central nodes of tourism in the city but also the industry’s spatial dispersion and growth. Although some hard rules exist (“constructing” a landmark will likely bring more tourists), often, public transit, landmarks, and street width can have counterintuitive and heterogeneous effects depending on their surroundings. Our analysis highlights the importance of context-specific and tailored recommendations that take into account the context of the built environment when constructing tourism-regulation policies.
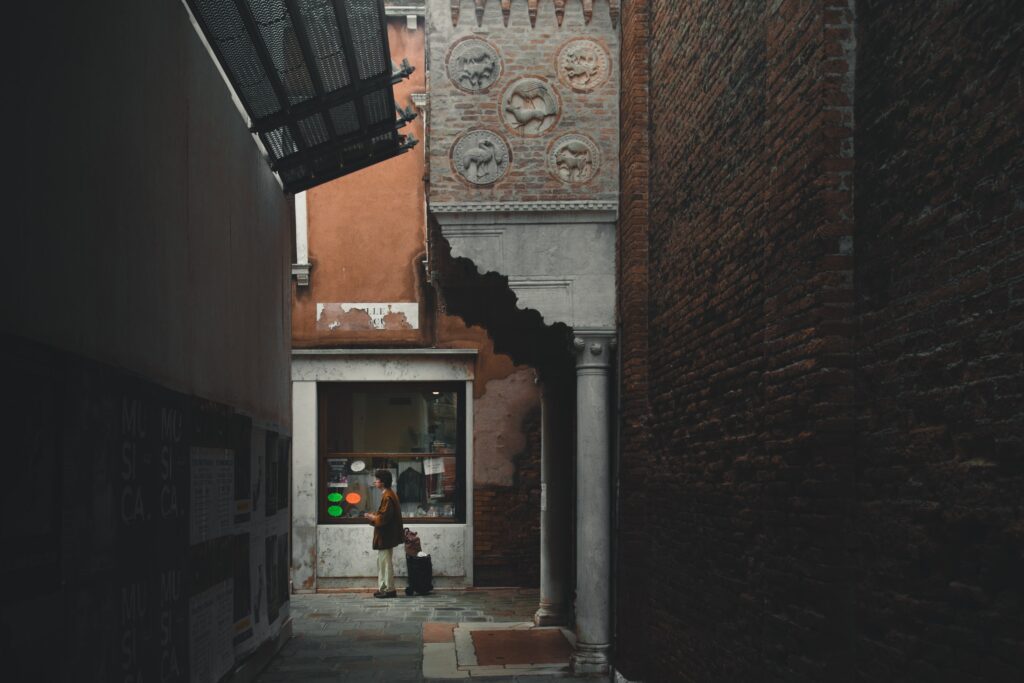
Products of Byzantine culture, patere are small, circular reliefs that dot the sides of buildings throughout Venice. They constitute the oldest type of Venetian public art | © Jiakun He, 2018
What’s Next?
Summer 2020: The Socially Distant Life of Small Urban Spaces
How social-distancing policies challenge the social and economic life of narrow Venetian streets
The pandemic has brought tourism to a startling halt. As the city seeks to reopen, officials must contend with an altered economic landscape. The narrow alleyways that made Venice so charming are now a threat to locals’ ability to practice social distancing. The lagoon city will no longer welcome six cruise ships a day to flood restaurants and kiosks with wealthy travelers.
Over the summer of 2020, we plan to continue our efforts exploring the effects of overtourism on the city of Venice and its people, but now in the context of today’s pandemic and the resulting collapse of the tourism industry. Our goal is to synthesize our findings from the tourism index model and spatial analysis to develop policy recommendations for the city of Venice, to help guide their future city planning in the aftermath of COVID-19.
These recommendations will answer a few important questions.
- How should the city manage its streets, canals, and public spaces to reduce overcrowding?
- What should empty short-term rentals (e.g. Airbnbs) and underutilized units (tourist shops) be repurposed for, given the expected decrease in tourist demand?
- And how should the city rethink its tourism industry and make it more sustainable?
